By: Nicolina Scarpelli
It has now become a rather standard exercise, with available technology, to construct graphs to consider the equation
ax2 + bx + c = 0
and to overlay several graphs of y = ax2 + bx + c for different values of a, b, or c as the other two are held constant. From these graphs, we can discuss the patterns for the roots of the equation ax2 + bx + c = 0. (Information retrieved from: Dr. Jim Wilson's EMAT 6680 Website)
Investigation 1: Changing the value of b
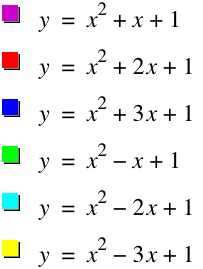
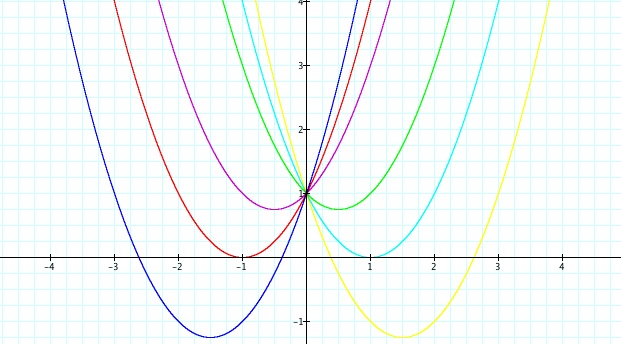
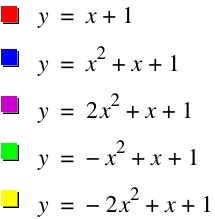
First, let's make a graph of the equation y = x2 + bx + 1 , and vary the b values from -3 to 3.
As you most likely can see, this is a graph of a parabola going through phase shifts and dilation. The first parabola we began with was y = x2 + bx + c with b equaling one (shown in purple). We will take this to be our "parent" graph and observe the changes with reference to that graph. The parabola shifts to the right or to the left as the value of b changes, and always passes through the same point on the y-axis at (0,1). For the values of b < -2, the parabola passes through the x-axis twice with positive x values; that is, the equation has two positive real roots. For the values of b > 2, the parabola passes through the x-axis twice with negative x values. This indicates that the equation has two negative real roots. For b = -2 and b = 2, the parabola "kisses" the x- axis (i.e. is tangent to the x–axis), so the original equation has one real positive root at the point of tangency, and one real negative root at the point of tangency. For -2 < b < 2, the parabola does not pass through the x-axis. This means that the equation has no real roots. The axes of symmetry vary for each parabola but they are given by the equation (-b) / 2a. Observe the animation below to see the movement of the parabola when the b value changes from -3 to 3, this might make the concept more clear.
Investigation 2: Graphs in the xb - plane
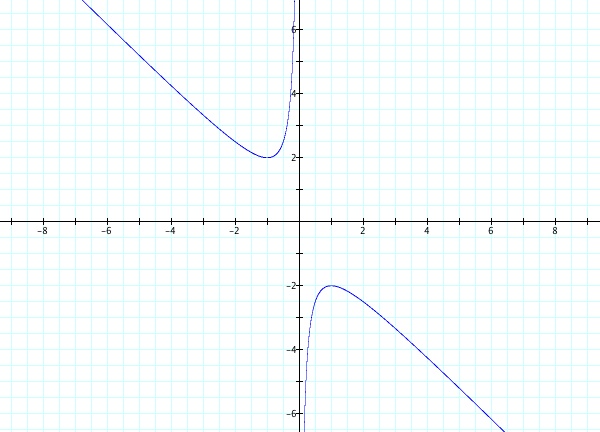
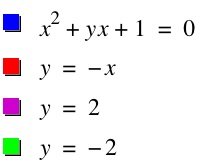
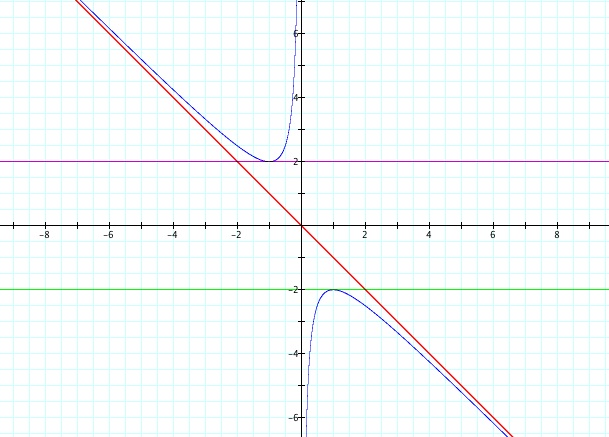
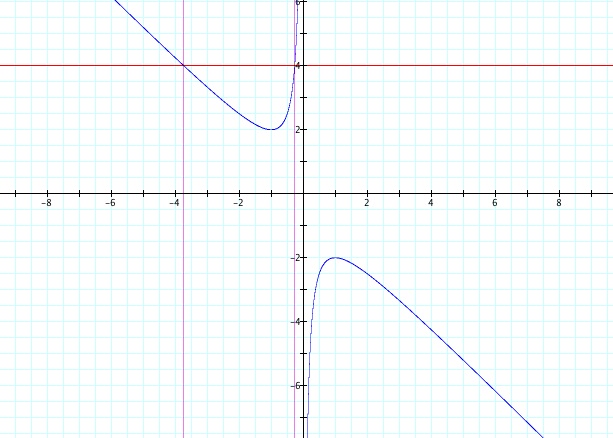
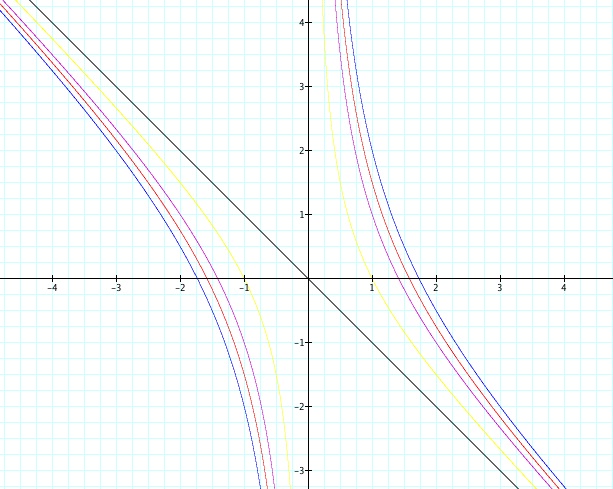
Let's consider the equation x2 + bx + 1 = 0. In order to graph this equation in the graphing calculator lite software, I had to set b = y, thus graphing the equation x2 + yx + 1 = 0.
As you may know, an asymptote is essentially a line that a graph approaches but does not intersect. Notice in this graph there is a vertical asymptote at x = 0 and a slant asymptote at y = -x. Also, from this graph, we can see when b = 2, the graph is tangent to y = 2, so this equation has one real negative root at the point of tangency. Also, when b = -2, the graph is tangent to y = -2. Thus, this equation has one real positive root at the point of tangency. This is shown in the graph below.
Now observe the graph below. If you take any particular value of b, such as b = 4 (the red line) , and overlay this equation on the graph of x2 + yx + 1 = 0 we obtain a line that is parallel to the x-axis. If b = 4 passes through the curve in the xb - plane, the intersection points aligns to the roots of the original equation for that value of b (i.e. the points align to the roots of the graph x2 + 4x +1 = 0).
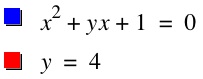
Now, the graph below will show b = 4 (the red line) passing through the curve of the graph x2+xy+1 = 0 in the xb plane. It shows the intersection points that align with the roots of the equation x2+4x+1 = 0.
From this graph, we can see that there are two negative roots of x2 + 4x + 1 = 0. To find these roots algebraically, I used the complete the square method, and found that x2 + 4x + 4 = -1 + 4 which simplifies to (x+2)2 = 3. Then to solve for x, I took the square root of both sides and then subtracted 2 from both sides to get x = -.26795 and x = -3.73205. From the graph above, you can see that the two vertical lines intersect the x-axis at these two x- values.
Continuing this idea, we see that for each value of b, we get a horizontal line, and the procedure that was shown above works the same for each value of b. By looking at the graph below
it clearly shows that we get two negative real roots of the original equation when b > 2, two positive real roots when b < -2 , one negative real root when b = 2, one positive real root when b = -2, and no real roots for -2 < b < 2.
An important thing to remember is that calculating the discriminant b2- 4ac will tell you how many real solutions a quadratic equation has. If b2-4ac > 0 , then the quadratic equation has two real solutions; if b2-4ac < 0, then the quadratic equation has no real solutions; and if b2-4ac = 0 then the quadratic equation has one real solution.
Next, we will look at how and why the changing of the c value from a positive to a negative will affect the number of real solutions a quadratic equation has.
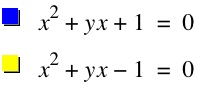
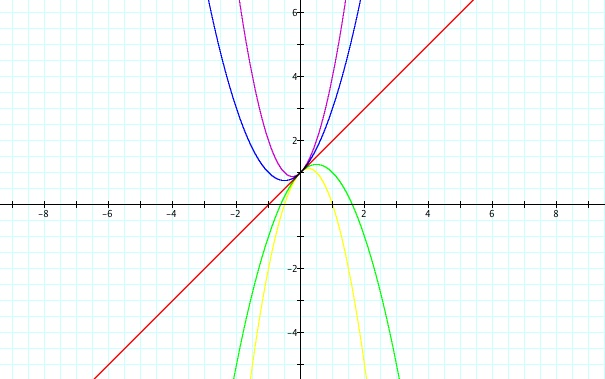
Investigation 3: Consider the case when c = -1 rather than +1. This results in the yellow line added to the graph.
From this graph we can see that there is still a vertical asymptote at x = 0 and the shape of the new graph is a hyperbola.
Let’s explore more by varying the values of c (focusing more on c being a negative instead of a positive).
By looking at the graph above, the equation, x2 + bx + c = 0, always has one real root when c = 0. For c > 0, the equation can have among two real roots, one root, or no root. When c < 0, the equation always have two real roots, one positive and one negative.
Investigation 4: Consider graphs in the xa plane.
Before we can consider the graphs in the xa plane, we must examine the effects of a itself on the equation and let b and c stay constant, b = c = 1. Thus, let's see the effects of the values of a on the graph ax2 + x + c = 0. Below the values of a = 0, 1, 2, -1, and -2.
When a = 0, the equation is no longer a quadratic equation, in fact it is a linear equation. As you can see from the graph, this line y = x + 1 represents a slant asymptote. Regardless of the value of a, the graph always crosses the y-axis at the point (0, 1). We can also determine that for a = 1 or a > 1, the graph has no real roots. For a = 0, it has one real root at -1 (the x-intercept of the line). When a < 0, the graph has two real roots.
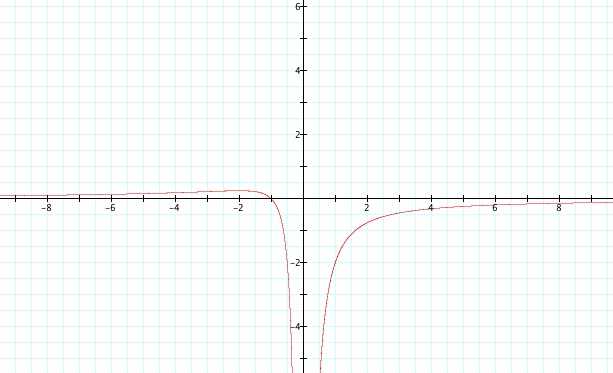
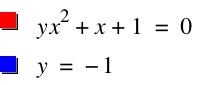
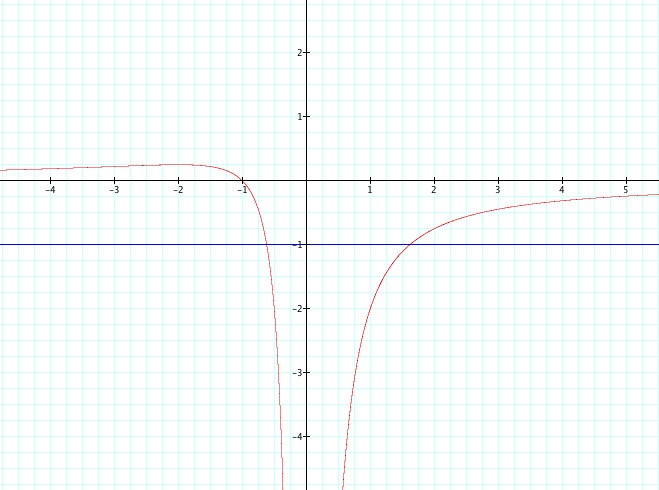
Now, let's focus on graphs in the xa plane, and consider again the equation ax2 + x + 1 = 0. By graphing this equation in graphing calculator, you must set a = y, thus graphing the equation yx2 + x + 1 = 0.
This graph appears to approach 0 as x approaches positive infinity and negative infinity. The graph has a vertical asymptote at x = 0. The graph also appears to only have one real negative zero at x = -1 . In order to prove that x = -1 is a zero, set a = 0 and the equations becomes x + 1 = 0, thus solving for x will give you x = -1. Now, if we let a = -1 and graph it, we see that the line crosses the graph at exactly two points. These two points will correspond to the solutions of the equation ax2 + x + 1 = 0. This is shown in the graph below.
This can also be proven using the discriminant as stated above. Similarly if we slide the line y = n up and down we see that the line crosses the graph at either 0, 1, or 2 places. If n > 1 the lines never intersect, meaning there are no solutions to our original equation. If n = 1 or 0 then there is only one solution to our original equation. And if 0 < n < 1 or n < 0, then there are two solutions to the original equation. Please view the animation below.
Quadratic equations are very important and useful throughout secondary education mathematics. These investigations were very helpful to me and I found many different ways to explain how to find solutions of a quadratic equation. The quadratic equation has many practical applications in the world beyond school, and finding the solutions of quadratic equations leads us to teaching the importance of the quadratic formula. In order to reach the maximum amount of students in my future high school classroom, I must focus on differentiated learning and explore new ways of explaining difficult concepts.